In my previous post, I explained how to use the symbol server in dotPeek 1.2 to debug any assembly in Visual Studio, allowing you to set breakpoints and step into any method (provided it was decompiled by dotPeek).
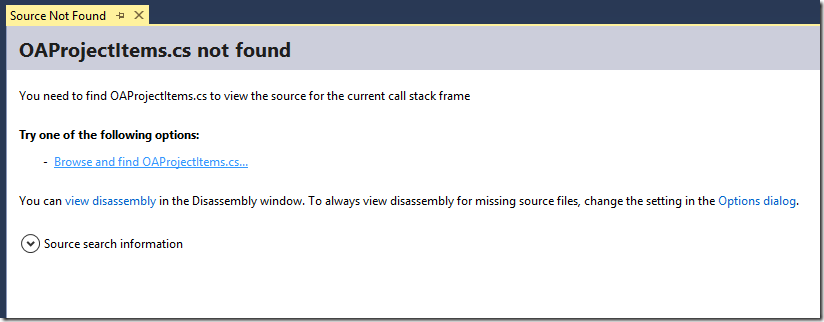
While this is great, I noticed that there was one particular method I couldn’t step into - the moment I tried I got the sadly familiar Source Not Found page:

Clicking the Browse and find… link did nothing, and the Source search information dropdown appeared below. Expanding it, I could see where Visual Studio attempted to load the source file from:

Locating source for 'C:\Users\Igal\AppData\Local\JetBrains\dotPeek\v1.2\SymbolCache\CSharp\Microsoft.VisualStudio.ProjectSystem.VS.Implementation.pdb\538887009A094E419882756878C69B2A1\Microsoft.VisualStudio.ProjectSystem.VS.Implementation\VisualStudio\ProjectSystem\VS\Implementation\Package\Automation\OAProjectItems.cs'. (No checksum.) |
And so on. Quick search for OAProjectItems.cs using my most favorite tool, Everything, revealed that it was indeed present in that location, so why couldn’t Visual Studio open it? I decided to open the file manually by pasting its full path into the Start - Run dialog (Win-R), but then I got the following error:

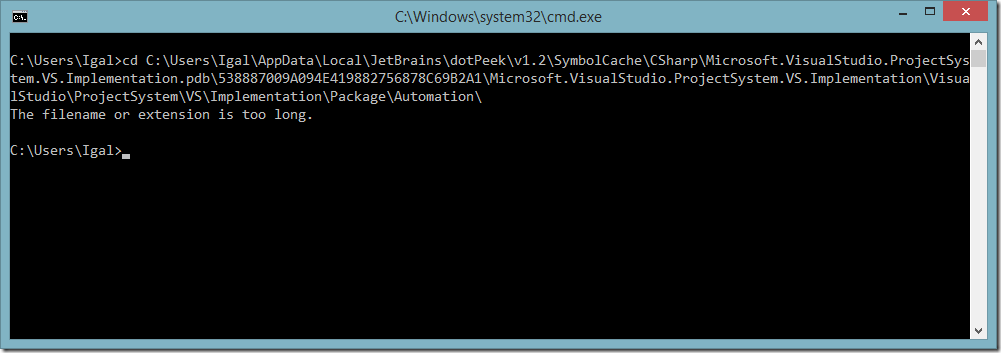
Finally, I tried to go to the file location using the cmd, and I got my answer - the path was simply too long for Windows (and therefore, Visual Studio) to handle!

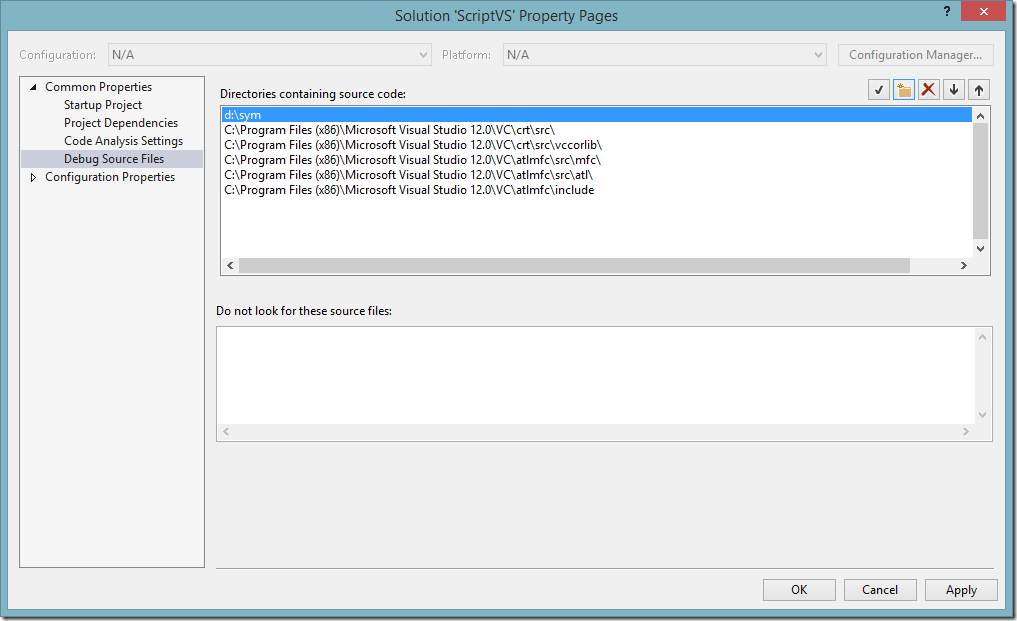
Windows has an unfortunate MAX_PATH limitation at 260 characters is the source of great pain, and I hope Microsoft fixes it one day. Meanwhile, here’s how to work around this particular issue: dotPeek generates debug symbols under %LOCALAPPDATA%\JetBrains\dotPeek\v1.2\SymbolCache\CSharp for C# code, and unfortunately, it isn’t possible to configure. Luckily, it is possible to configure where Visual Studio looks for debug symbols. This is a little-known page in the Solution properties called Debug Source Files:

What I did was copy the entire contents of dotPeek’s SymbolCache\CSharp directory into a local directory d:\sym, and added it to the search list (pictured above). Also, I made sure to delete everything from the bottom list (Do not look for these source files) - if Visual Studio is unable, for any reason, to open a source file, it will add it to this blacklist. It was filled with the files I needed, so I removed them from the list.
After doing this, I could go back to debugging, was was able to step into methods that were previously unavailable!
As the comments below mention, this is also possible to do without copying, by creating a (symbolic) link between the directories! From an elevated command shell, run:
mklink /D d:\sym %localappdata%\JetBrains\dotPeek\v1.2\SymbolCache\CSharp |
Thanks guys!
Happy debugging!