Sometimes, we wish we could just step into some 3rd party library, to figure out how it works, but we either don’t have the source code, or otherwise just can’t. Fortunately, this is made possible by dotPeek v1.2 that was just released, which can act as a symbol server for decompiled assemblies!
So let’s suppose we want to put a breakpoint inside Console.WriteLine (or any other method in any other assembly). Here’s what we need to do:
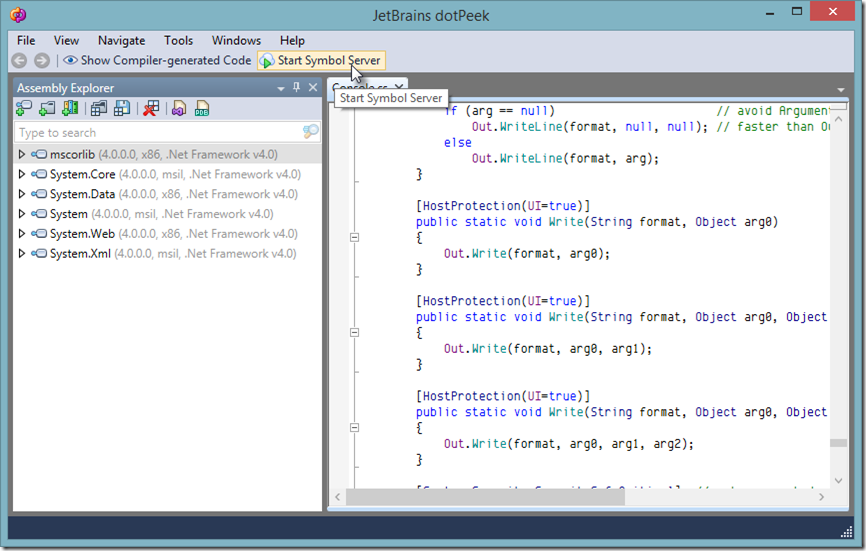
- Open dotPeek, add the required assemblies to the Assembly Explorer, and press the Start Symbol Server button.

You can configure the port and the symbol generation settings in Tools - Options. The default address is http://localhost:33417/.
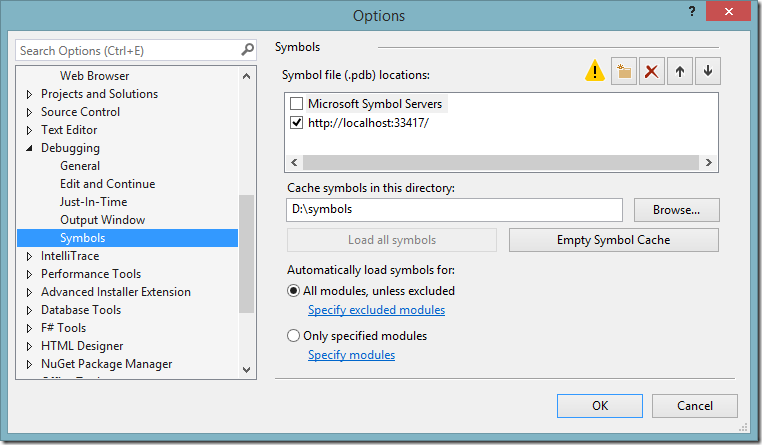
- In Visual Studio, go to Tools - Options, then navigate to Debugging - Symbols. Add the location of the dotPeek symbol server.

In addition, make sure that Just My Code (in General) is unchecked, and press OK. Some symbols will be loaded, this might take a few moments.
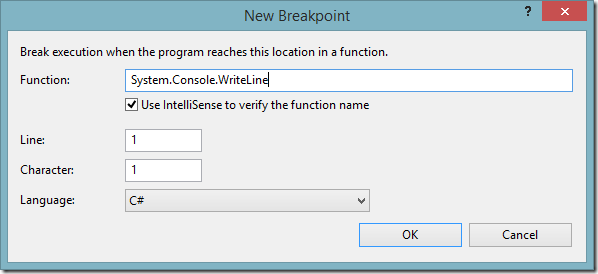
- Next, we need to set a breakpoint inside the method which we’re interested in. This can be done with a little-known Visual Studio trick, allowing you to create a breakpoint at any function. Go to Debug - New Breakpoint - Break at Function, and in the dialog enter the fully qualified method name, e.g.
System.Console.WriteLine.

After pressing OK, you’ll get a message saying IntelliSense could not find the specified location. Do you still want to set the breakpoint?. It’s fine - press Yes.
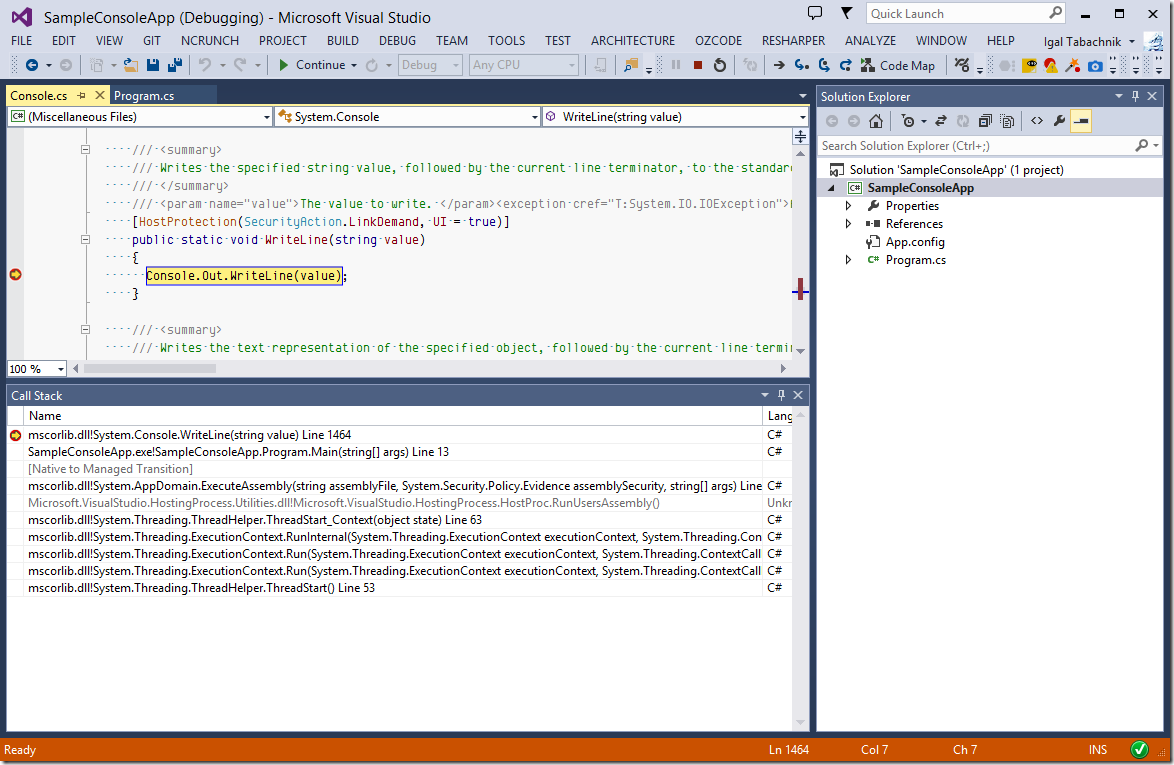
- Finally, start your application with the debugger (F5) and you will stop at the breakpoint! You can use all familiar debugging options, such as stepping over/into, watch, autos and the datatip.

Happy Debugging!