I was delighted to talk about ReSharper at the recent meeting of the ALT.NET Israel group. I chose ReSharper for the reason that I use it every day, and I can’t imagine myself programming without it. I wanted to share with the rest some tips, tricks and general hidden features of this wonderful tool that I’ve learned over the years using it.
ALT.NET Tools meetings are series of short demos (about 20 minutes per speaker). It was my first time speaking to a large group of people, and I wasn’t sure if I could keep their attention. I ended up giving a good 40 minute talk, and managed to wow everyone in the room during the process!
For the demo I used the following: ReSharper 5.1 (I used the latest nightly build, however the official release is recommended), Agent Smith Plugin (an open-source code style validation plugin for ReSharper) and Philip Laureano’s LinFu as the demo project.
The first feature that I demonstrated was a live template that comes out of the box, called nguid. This allows you to instantly create a new GUID anywhere: in source files, XML/Config files or any text file that is opened within Visual Studio, just by typing nguid and pressing the Tab key. If you require lots of GUIDs (when working with WiX Installer, for instance), this will save a lot of time by generating new GUIDs on the fly.
One of my most used features of ReSharper is the ability to navigate to the recent place an edit occurred. By pressing Ctrl-Shift-Backspace, you will be immediately taken back to the last place you changed code. Repeat to go back to all places an edit took place. To view a list of all recent files, press Ctrl-, (Visual Studio) or Ctrl-E (IDEA).

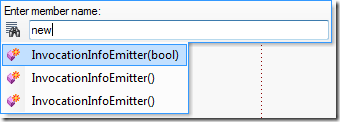
I learned this neat trick fairly recently from JetBrains’ own Hadi Hariri, while looking for interesting topics to discuss at the meeting. In any code file, type new into the Go To File Member navigation (Alt-/ [Visual Studio] or Ctrl-F12 [IDEA]), and it will list all constructor first!
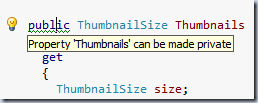
I wrote about the benefits of turning Solution-wide analysis back when I reviewed ReSharper 4.5 Beta. Several things happen when Solution-wide analysis is enabled - all public and protected methods are now analyzed for usage and visibility. This allows, for instance, making public methods private (if they are unused outside the class), or removing them completely, if they aren’t used at all.
A word of caution when changing visibility (or even removing) unused public classes - make sure that your code is not being called dynamically (i.e. via MEF, or reflection). ReSharper will not detect such usage, and you might end up with broken references.
Another important benefit of working with Solution-wide analysis enabled is the ability to immediately detect errors in the entire solution, rather than just the current file. The Next/Previous error navigation (Shift-Alt-PgDn/PgUp [Visual Studio] or Alt-F12/Shift-Alt-F12 [IDEA]) will now take you to all errors in your solution.
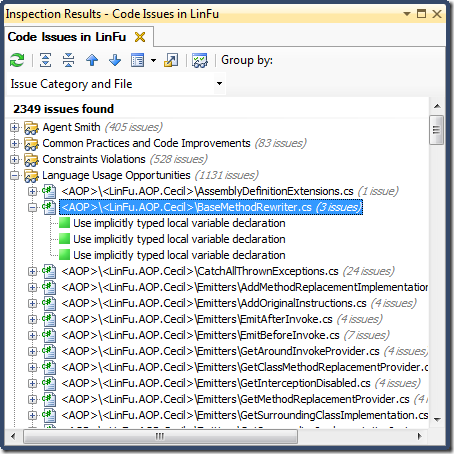
At this point I was asked if there was a way to list all ReSharper hints, suggestions and warnings - indeed there is, and it’s called Code Issues. It’s available from ReSharper’s ReSharper – Inspect menu, in form of Code Issues in Current Project or Code Issues in Solution. Depending on the size of your solution, the initial analysis of all your files might take a few minutes (this is reduced greatly if Solution-wide analysis is enabled). After the wait, all ReSharper’s suggestions are presented in a tool window:
The next thing I talked about is the SSR. I wrote about SSR previously in greater detail, and I demonstrated how to convert NUnit’s Assert syntax to its fluent API. I also demonstrated how to use Agent Smith Plugin to document the public API.
THE FOLLOWING IS AN UNDOCUMENTED, UNSUPPORTED FEATURE OF RESHARPER. USE THIS AT YOUR OWN RISK!
Before I even started my talk, I asked the audience who used ReSharper to raise hands. Of almost 40 people, I think 90% raised their hands. I guaranteed them that the feature I was about to show was something they never heard of before, and I was pleased to have been right!
ReSharper’s Internal Mode (or God-mode or iddqd, as it was referred to around the room) is an internal set of tools and commands, used mostly by ReSharper developers at JetBrains. To enable it, start Visual Studio with the following command line switch:
devenv.exe /ReSharper.Internal
You will now have a new menu in ReSharper’s menu called Internal. There are many things available here, some of which are of no use to anyone outside JetBrains. I am going to show two most useful ones.
PSI Browser and PSI Viewer
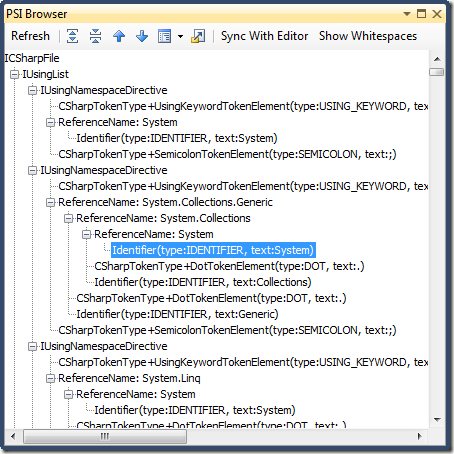
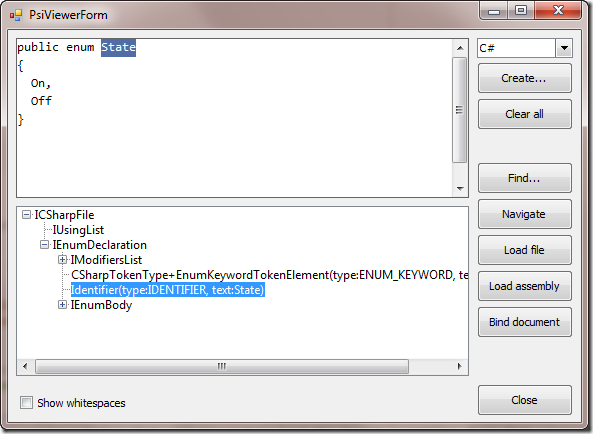
PSI (Program Structure Interface) is JetBrains implementation of Visual Studio’s AST (Abstract Syntax Tree). It allows representing every single construct of a source file in a syntactic tree. These tools are an indispensible aid for plugin developers, for instance, when trying to understand the structure of the source code.
PSI Browser (located under Windows) displays the entire structure of the currently opened file. By double clicking any element, it will jump to the corresponding place in the source code.
PSI Viewer is a great utility to create code snippets on the fly, and view their PSI representation.
Concurrent building with MSBuild
After turning on Internal mode, upon trying to build the solution for the first time, you will be presented with the following dialog:
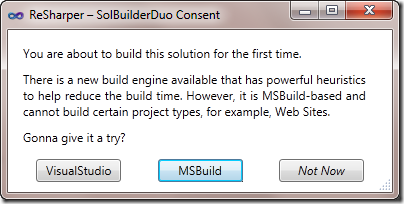
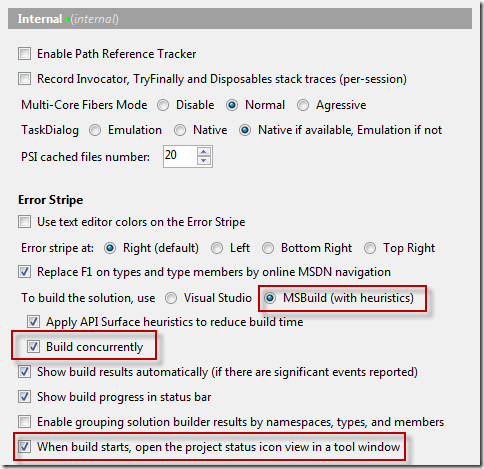
By selecting MSBuild, ReSharper will build the solution using MSBuild, rather than the Visual Studio builder. One advantage MSBuild has over Visual Studio is the ability to utilize multiple cores of the CPU to build the solution concurrently. This is disabled by default, to enable it, go to ReSharper - Options. The options dialog will look slightly different when Internal mode is enabled. Menu items having a green circle on their right are only available in Internal mode. Scroll all the way down, under Tools, and select the Internal menu. On the right side make sure that the highlighted items are checked:
Since MSBuild is not integrated into Visual Studio, when building you will not be able to see the build progress in the output window. The project status view is a tool window which shows all the projects in solution (abbreviated), and displays their build progress by using colors.

Please note that this is an experimental build technique, and it might not work correctly for your solution. Like all other features above, use this at your own risk.
